Filesystem caching and performance
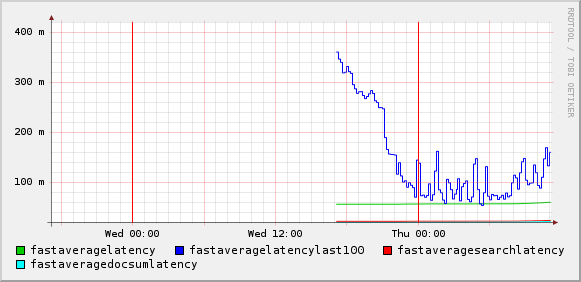
well this is slightly surprising, but in a very good way, and does lead to some interesting suggestions on how to best to improve matters, but look at the following graph of FAST ESP query latency:

Notice that the average latency drops as we use the server more … but WHY? Well that’s just because we’re running the FAST indexes on a ZFS based file system and the L2 ARC cache is making it’s presence felt
# arcstat.pl
Time read miss miss% dmis dm% pmis pm% mmis mm% arcsz cur
11:25:52 13G 263M 1 158M 1 104M 15 44M 11 2G 2G
11:25:53 29K 103 0 97 0 6 2 2 15 2G 2G
11:25:54 10K 161 1 156 1 5 13 1 9 2G 2G
11:25:55 10K 197 1 174 1 23 18 3 50 2G 2G
Of course, I’d really like to try playing with a few Enterprise grade SSDs to supplement the L2 ARC - should be able to soak most of the “hot” data from SSD without going back to the spinning rust (admittedly the full index data set is only 80GB)
patiently waits for Sun to get their fingers out
Update Using Ben Rockwood’s arc_summary.pl tool we get the following view into the ARC cache:
ARC Size:
         Current Size:             4659 MB (arcsize)
         Target Size (Adaptive):   4659 MB (c)
         Min Size (Hard Limit):    1023 MB (zfs_arc_min)
         Max Size (Hard Limit):    31735 MB (zfs_arc_max)

ARC Size Breakdown:
         Most Recently Used Cache Size:          29%    1393 MB (p)
         Most Frequently Used Cache Size:        70%    3266 MB (c-p)

ARC Efficency:
         Cache Access Total:             1464939081
         Cache Hit Ratio:      91%       1342983472     [Defined State for buffer]
         Cache Miss Ratio:      8%       121955609      [Undefined State for Buffer]
         REAL Hit Ratio:       78%       1146170142     [MRU/MFU Hits Only]

         Data Demand   Efficiency:    91%
         Data Prefetch Efficiency:    86%

        CACHE HITS BY CACHE LIST:
          Anon:                       10%        142482495              [ New Customer, First Cache Hit ]
          Most Recently Used:          5%        74249410 (mru)         [ Return Customer ]
          Most Frequently Used:       79%        1071920732 (mfu)       [ Frequent Customer ]
          Most Recently Used Ghost:    1%        19996413 (mru_ghost)   [ Return Customer Evicted, Now Back ]
          Most Frequently Used Ghost:  2%        34334422 (mfu_ghost)   [ Frequent Customer Evicted, Now Back ]
        CACHE HITS BY DATA TYPE:
          Demand Data:                53%        712758575
          Prefetch Data:              17%        241164086
          Demand Metadata:            20%        280805976
          Prefetch Metadata:           8%        108254835
        CACHE MISSES BY DATA TYPE:
          Demand Data:                52%        64233340
          Prefetch Data:              30%        36667246
          Demand Metadata:            15%        19272211
          Prefetch Metadata:           1%        1782812