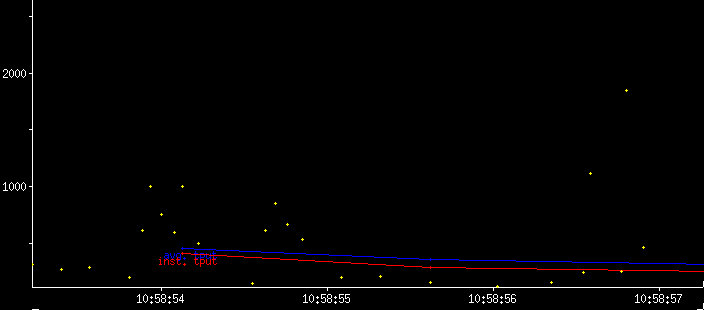
playing with TCP Trace
# tcpdump -ni en0 port 80 -w output.trace
# tcptrace -G output.trace
# xplot *tput.xpl

From the online manpage:
Yellow: instantaneous packets Red: Throughput for the last few packets Blue: Throughput since the start of the stream/connection
Other useful graphs:
- _owin.xpl - outstanding data/congestion
- _rtt.xpl - round trip time/time
- _ssize.xpl - segment size/time
- _tput.xpl - throughput/time
- _tsg.xpl - time sequence graph
- _tline.xpl - Timeline graph - W Richard Stevens style
Just some notes here so I don’t forget the basics - manual over at here